The Usage insights tab displays how you're using tasks throughout the current billing cycle. In this tutorial, you'll learn how to access the tab and understand the information it displays, so you can monitor your usage and keep your critical workflows running.
Available on plans:
Free
Professional
Team
Enterprise
Before you begin
On Team and Enterprise plans, the Usage insights tab is available to specific roles:
| Plan | Roles with access |
|---|---|
| Team | Admin, Owner |
| Enterprise | Admin, Super Admin, Owner |
Where can I find the Usage insights tab?
You can find the tab in the Billing and usage settings.
- Go to the Billing and usage settings.
- Click the Usage insights tab.
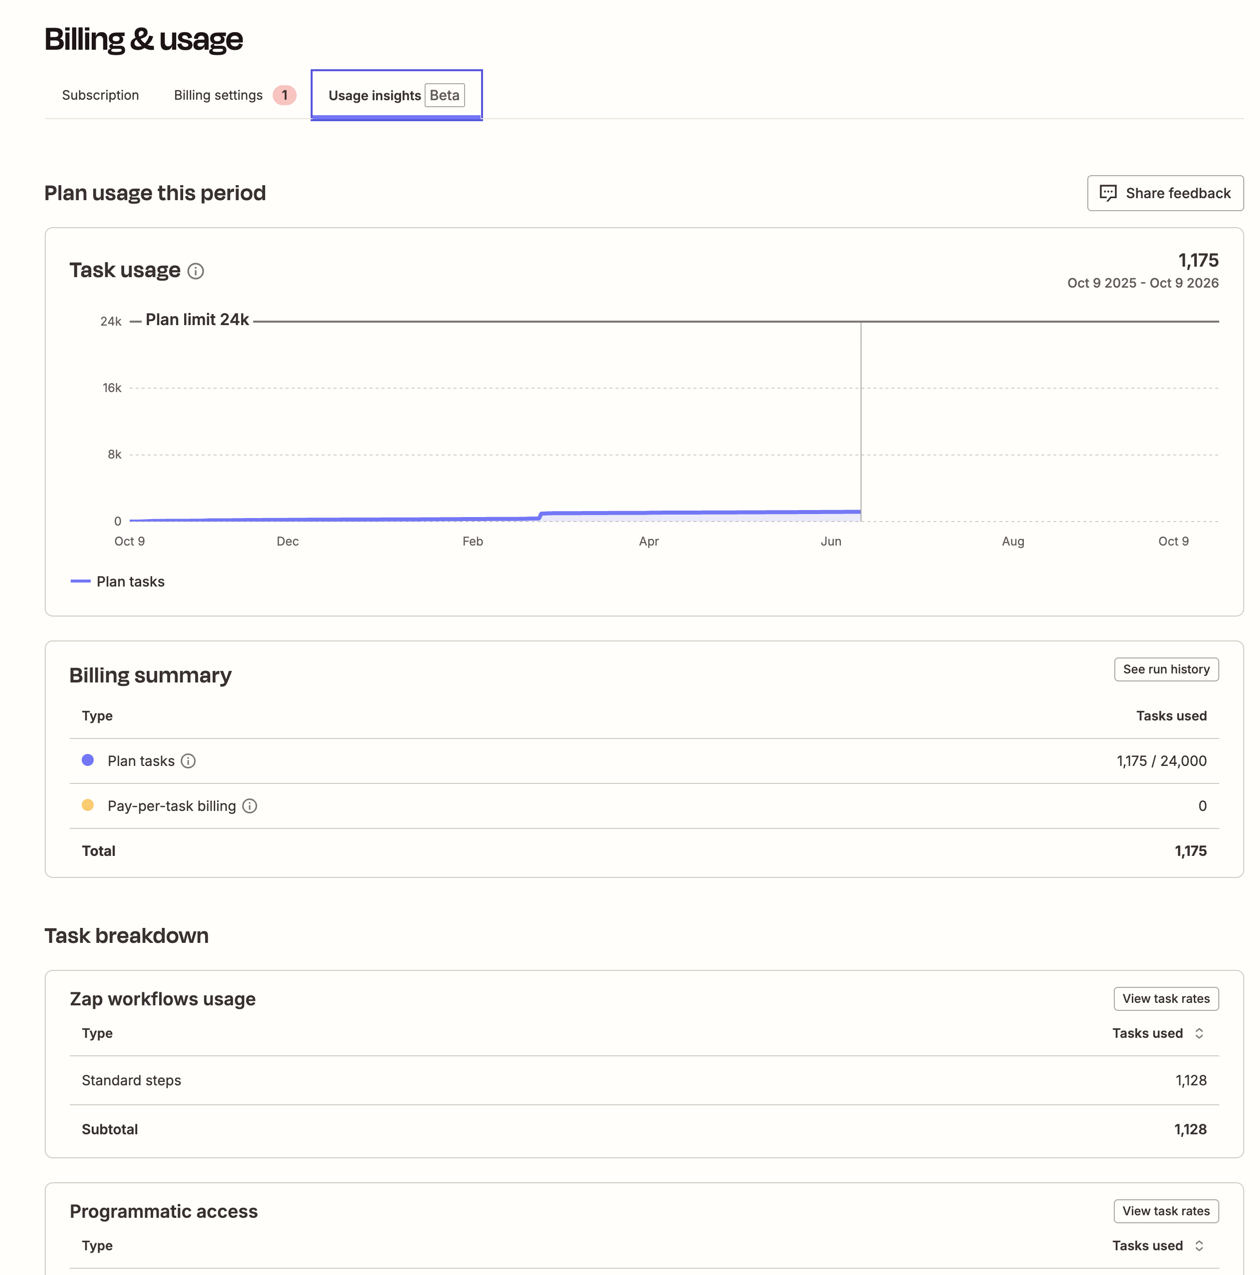
What information is available in the tab?
The Usage insights tab displays two sets of information:
- A graph showing task usage as a line, plotting the number of tasks used per day within the current billing period.
- A table displaying the usage by type, with one row for plan-included tasks and one for pay-per-task billing.
Task usage graph
On the graph, you can find the number of billable tasks used each day during the current billing period. You can find the total billable tasks at the top right. The maximum number of tasks displayed on the Y axis will depend on your plan and whether you have pay-per-task billing enabled for your account.
Table with usage by type
This table displays:
- The type of task used.
- The number of tasks used.
- The price per unit.
- The estimated cost.
This information is broken into different types of usage:
- Tasks included in the plan.
- Pay-per-task billing.
- Promotional tasks.
Pay-per-task billing and promotional tasks will only appear if:
- You turn on pay-per-task billing.
- You've met the eligibility for promotional tasks.
Projections and alerts
When your account reaches 80% of your total tasks for that billing period, the usage graph will display a projection of future task usage. This is an estimate of how many more tasks you might use before the end of that period. You'll also receive alerts on the screen when it reaches 80% and 100% of your task limit. You can then upgrade your plan or, if you have not used it yet, turn on pay-per-task billing.
Limitations
The data on the Usage insights tab may differ from task usage displayed on your Task history, because:
- The graph only displays the current billing period in the UTC time zone. Your profile may have set a different time zone, and your task history may display a different date range.
- This tab only displays billable items. This means that tasks that are not charged will not be accounted for in usage insights.
Next steps
You can now monitor your task usage directly from the Usage insights tab.
- Learn which actions count as billable tasks.
- Keep your Zap workflows running after you reach your plan limit by turning on pay-per-task billing.
- Upgrade your plan if you consistently reach your task limit.