Available on plans:

Free
Professional
Team

Enterprise
Use the analytics dashboard to get more visibility and control over your account usage. Easily identify trends and inefficiencies by reviewing top metrics for your account:
- Total plan usage.
- Successful run rate.
- Number of active Zap workflows.
- Number of active members.
- Task usage by date, Zap, app, or member.
- Error rate.
- Number of alerts.
- MCP servers, MCP clients, and MCP error rate.
- MCP usage by server, client, member, and app.
You can access Analytics any time from the main navigation sidebar or by going directly to the Analytics page.
Pre-requisites
You must be an admin, super admin, or owner of the account to access the Analytics page.
KPIs
At the top of the page, there are KPIs (key performance indicators) for your account:
- Active Zap workflows: the total number of Zap workflows turned on.
- Active members: the total number of account members.
- Plan usage: the percentage of your plan’s task limit used by your Zap workflows. It does not include MCP tasks.
- Successful run rate: the percentage of successful runs compared to the total number of successful and errored runs.
- Alerts: the number of alerts for Zap workflows that are experiencing issues.

Date selector
The date selector allows you to filter analytics for a particular time period:
- Past 7 days: Filter by the last 7 days, including today.
- Current usage cycle: Filter by your current billing cycle.
- This month: Filter by the current calendar month.
You can also select a custom date range by selecting a start date and end date in the date picker.

ROI calculator
The ROI (return on investment) calculator determines how much time you saved by automating your workflows in Zapier. By default, your ROI is measured by estimating 2 minutes saved per task (successful action step) performed by a Zap. Click the How was it calculated? link to adjust the estimate of time saved per task.

Task usage
The Task usage section displays a chart of how many tasks you have used in the time period you select.
-
Current period: the number of tasks you’ve already used in the time period. The chart shows total usage and the MCP portion of that total.
- Zaps: the number of tasks used by your Zap workflows.
- MCP executions: the number of tasks used by MCP servers in your workspace.
-
Projected usage: based on your current rate of use, how many additional tasks Zapier estimates you’ll use by the end of the time period.
- It is only displayed if future dates are included in the time period.
- Task limit: the total number of tasks included in your Zapier plan, not including pay-per-task limits.

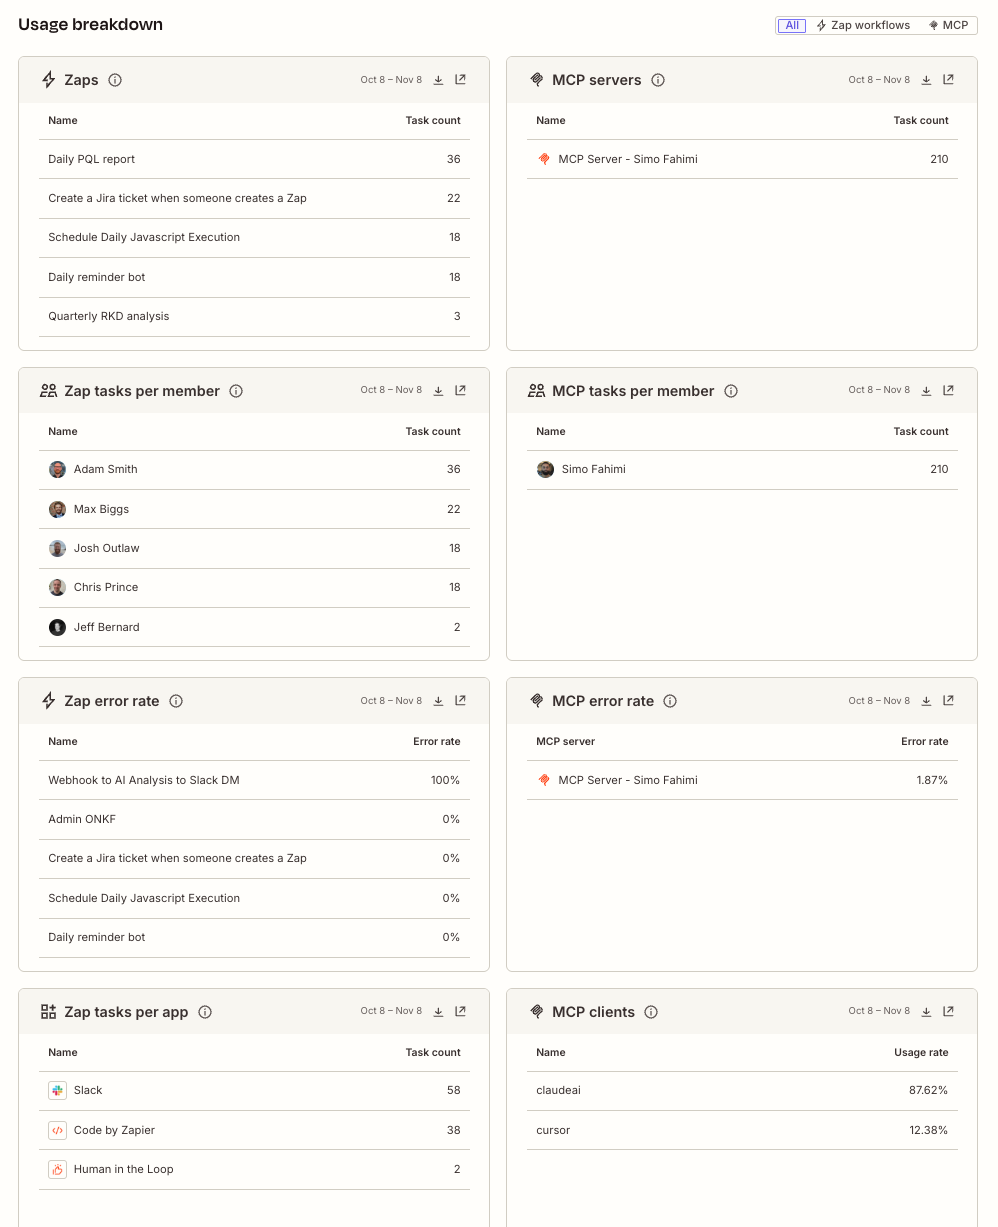
Usage breakdown
The Usage breakdown section displays the top usage in the following categories:
- Zaps: the Zaps with the most tasks in the selected period.
- Zap tasks per member: the members whose Zaps ran the most tasks in the selected period.
- Zap error rate: the Zaps with the highest error rate in the selected period. Tasks calculated hourly.
- Zap tasks per app: the apps with the most tasks run by your Zaps in the selected period.
- MCP servers: the MCP servers with the most tasks in the selected period.
- MCP tasks per app: the apps with the most MCP tasks in the selected period.
- MCP tasks per member: Members with the most MCP tasks in the selected period.
- MCP error rate: MCP servers with the highest error rate in the selected period.
- MCP clients: Share of MCP tasks by client. Tasks calculated daily.
Click the view full report icon in a card to open a full list of all usage for that category. You can also click the download icon , to download a CSV file of each report to your local computer. The CSV includes a max of 5,000 rows of data. You can filter the cards by All, Zap workflows, or MCP servers.
 in a card to open a full list of all usage for that category. You can also click the download icon
 , to download a CSV file of each report to your local computer. The CSV includes a max of 5,000 rows of data. You can filter the cards by All, Zap workflows, or MCP servers.
 Note
MCP task counts match your billing for all dates. Details by app, server, client, and member are available from April 1, 2026. MCP usage without these details appears in MCP reports as Unattributed. This includes all MCP usage before April 1, 2026, and a small share of later usage, less than 1%. The Unattributed row appears only if the selected period has unattributed usage.
MCP observability shows aggregate activity for your workspace. It does not include individual execution traces or payloads, reporting across workspaces, or MCP server inventory and management.
Error rates are calculated as the percentage of successful runs compared to the total number of successful and errored runs. Learn more about Zap run statuses.
To investigate errors, open Usage by MCP server and sort by Error rate. The Client and Owner columns show who to contact.